| Convocatoria electoral del 24 de mayo de 2015 |
|---|
|
 |
||||||||||||||||||||||||||
|
Elecciones Cortes de Aragón |
||||||||
| Votos 2015 | % | Votos 2011 | % | Votos 2007 | % | Votos 2003 | % | |
| PP | 62 | 47,33 | 98 | 98 |
79 |
55.63 |
99 |
74.44 |
| PSOE | 27 | 20,61 | 22 | 13,66 |
26 |
18.31 |
14 |
10.53 |
| PAR | 16 | 12,21 | 24 | 14,91 | 19 |
13.38 |
15 |
11.28 |
| PODEMOS | 16 | 11,45 | ||||||
| CIUDADANOS | 4 | 3,05 | ||||||
| LOS VERDES | - | - | - | - | 2 |
1.41 |
1 |
0.75 |
| CHA | 1 | 0,76 | 3 | 1,86 | 2 |
1.41 |
1 |
0.75 |
| FAMILIA Y VIDA | - | - | - | - | 1 | 0.70 | 1 | 0.75 |
| IU | 1 | 0,76 | 1 | 0,62 | 1 | 0.70 | - | - |
| Partido antitaurino PACMA | - | - | 2 | 1,24 | ||||
| VOTOS BLANCOS | 5 | 3,82 | 8 | 4,97 | 10 | 7.04 | 1 | 0.75 |
| VOTOS NULOS | 9 | 6,43 | 3 | 1,86 | 2 | 1.41 | 1 | 0.75 |
| TOTAL VOTOS EMITIDOS | 140 | 100 | 161 | 100 | 142 | 100 | 133 | 100 |
Curiosidades: |
|||||||
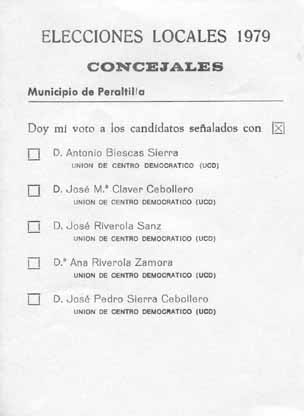
1.979 |
1.991 |
1.995 |
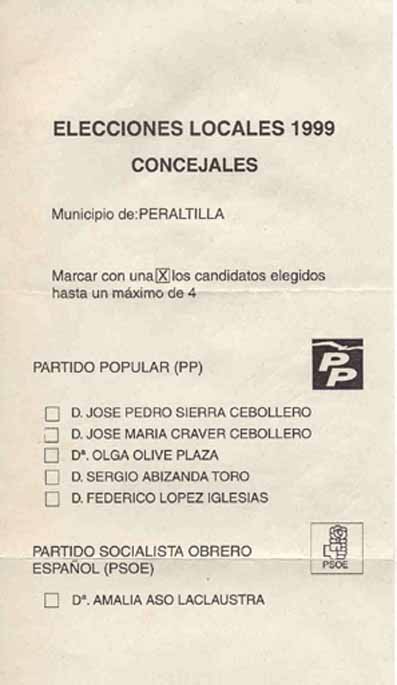
1.999 |
|
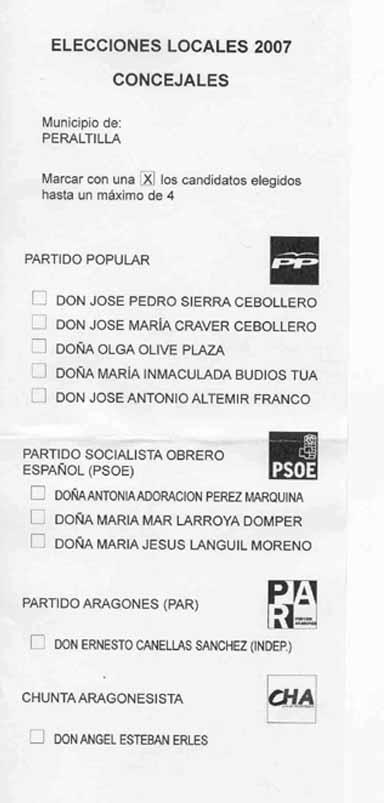
2.007 |
2.011 |
|
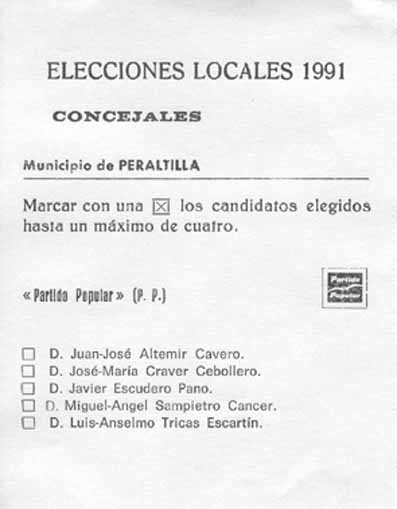
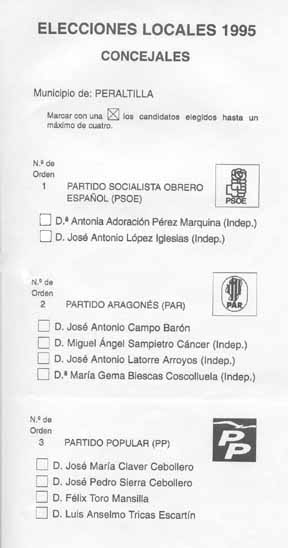
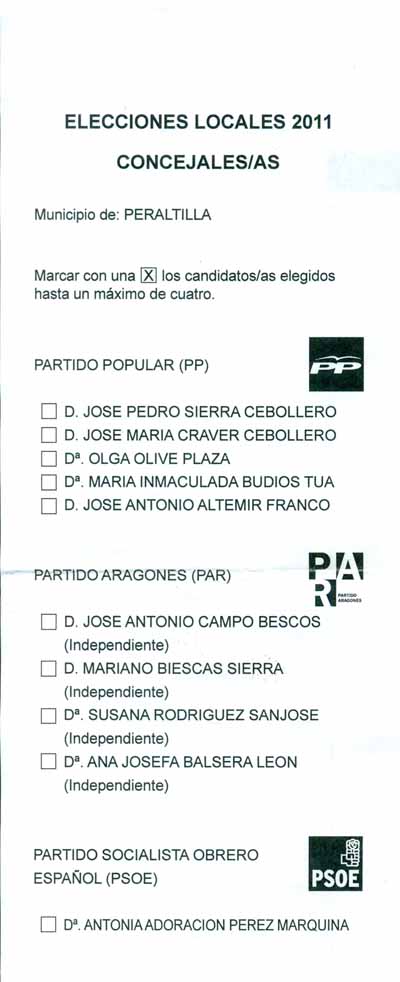
| Procesos electorales. Resultados en Peraltilla |
| 12-03-2000 Generales Congreso y Senado |
| 13-06-1999 Municipales y autonómicas |